 Download
Tired of wrestling with quantifiable data? Easy Graph simplifies data tracking and management. Perfect for monitoring anything from electricity consumption to project milestones, this app streamlines the process. Its intuitive interface allows for easy daily data entry, instantly transforming your numbers into insightful value graphs and growth charts. Need deeper analysis? Export your data as a text file for further processing on your computer. Easy Graph is the ultimate tool for efficient monitoring and reporting.
Easy Graph Key Features:
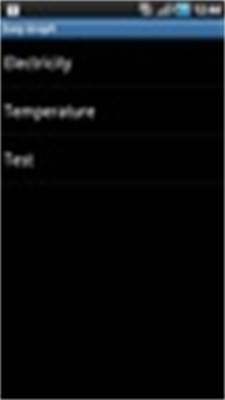
- Effortless Data Management: Easily track and manage numerous data sets. Simplify the recording of metrics like energy usage.
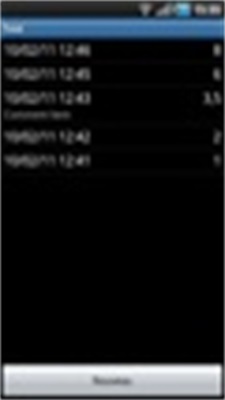
- Streamlined Data Input: Manage multiple date/value lists with a user-friendly interface for convenient daily data entry.
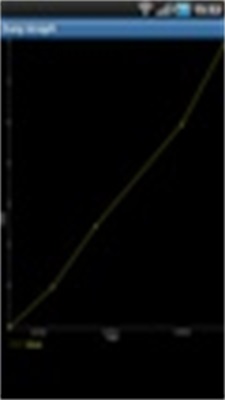
- Clear Visualizations: Understand your data at a glance with clear value graphs and growth line charts. Easily identify trends and progress.
- Data Export: Export your datasets to a text file for advanced analysis on your computer. Perfect for detailed reporting.
- Intuitive Design: Efficient data management is made simple with an intuitive graphical user interface.
- Permissions: The app requires internet access (primarily for ads) and write access to external storage (for data export). These are essential for full functionality.
In short: Easy Graph provides a user-friendly solution for anyone needing to monitor and visualize their metrics. Whether for personal or professional use, its ease of use, clear visualizations, and data export capabilities make it an invaluable tool. Download Easy Graph today for hassle-free data management.